
East Suffolk's claimant count held at 3,860 in September while the region rose 2%. Under-25s rose again; Felixstowe Seafront is at 3.7%, Woodbridge 2.3%.
The number of people claiming unemployment-related benefits in East Suffolk barely moved in September. The count was 3,860, five more than in August and the same as in July. That is 2.8 per cent of residents aged 16 to 64.
The figures come from the Office for National Statistics claimant count, published on Tuesday. (ONS claimant count for East Suffolk, via Nomis)
A flat month matters because most places went the other way. Across the East of England the count rose by 2,600 in September, about 2 per cent. Across England and Wales it rose by 36,405, about 2.4 per cent.
How the neighbours moved in September
| Area | August | September | Change | Rate |
|---|---|---|---|---|
| East Suffolk | 3,855 | 3,860 | +5 | 2.8% |
| Ipswich | 3,875 | 3,970 | +95 | 4.5% |
| West Suffolk | 2,860 | 2,915 | +55 | 2.5% |
| Babergh | 1,305 | 1,330 | +25 | 2.4% |
| Mid Suffolk | 1,320 | 1,315 | -5 | 2.0% |
| East of England | 129,805 | 132,405 | +2,600 | 3.3% |
| England and Wales | 1,523,510 | 1,559,915 | +36,405 | 4.0% |
Source: ONS claimant count via Nomis. The ONS rounds every figure to the nearest five.
The year-on-year picture is less comfortable. September’s 3,860 is 165 higher than in September 2025, a rise of about 4.5 per cent. Over the same year the count rose about 4.1 per cent across the region and 2.7 per cent across England and Wales.
The district peaked at 4,160 in March and is now 300 below that. Since July it has stopped falling. The ONS also revises earlier months: June, which we reported in August as 3,940, now stands at 3,910.
Under-25s are rising again
The flat total hides a shift between age groups.
- Aged 16 to 24: 925 in September, up for a third month in a row from 875 in June. A year ago it was 815, so the rise is 110.
- Aged 25 to 49: 1,945, down 20 on a year ago.
- Aged 50 and over: 990, down from 1,040 in July but 75 higher than a year ago.
So young people account for two thirds of the district’s rise over the year. Men make up 2,175 of the claimants and women 1,685, both unchanged since July.
Felixstowe and the coast, neighbourhood by neighbourhood
The district figure blends the coast with Lowestoft, Beccles and Bungay. The ONS also publishes the count for small neighbourhoods called MSOAs, each with roughly 5,000 to 15,000 residents. The House of Commons Library gives them local names, which we use here.
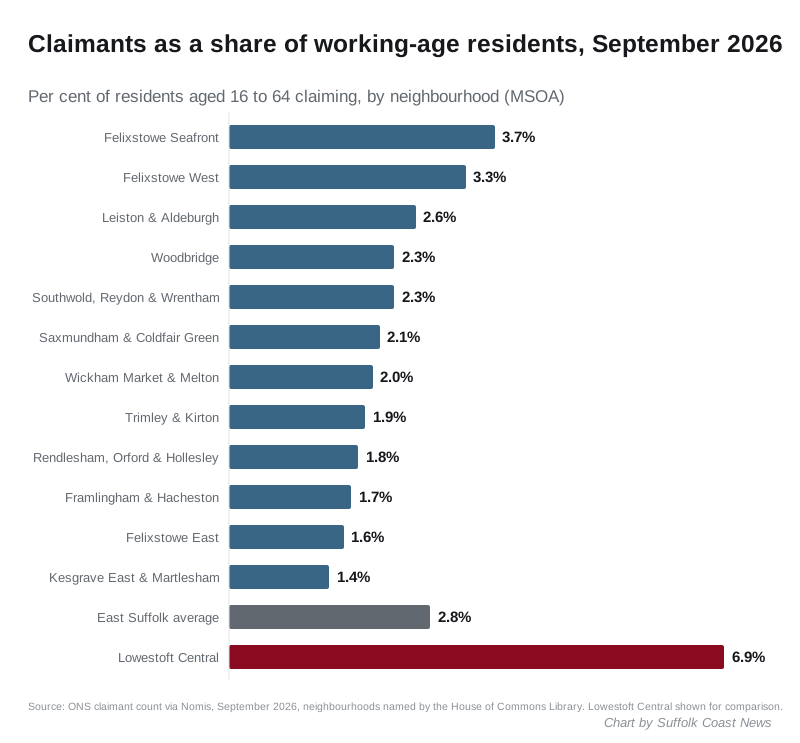
On the coast from Felixstowe to Southwold, two neighbourhoods sit above the district rate of 2.8 per cent. Both are in Felixstowe.
- Felixstowe Seafront: 130 claimants, 3.7 per cent
- Felixstowe West: 170 claimants, 3.3 per cent
- Leiston and Aldeburgh: 115 claimants, 2.6 per cent
- Woodbridge: 95 claimants, 2.3 per cent
- Southwold, Reydon and Wrentham: 65 claimants, 2.3 per cent
- Saxmundham and Coldfair Green: 110 claimants, 2.1 per cent
- Wickham Market and Melton: 85 claimants, 2.0 per cent
Felixstowe East is at 1.6 per cent, so the town has both the highest and one of the lowest rates on the coast. The lowest in the district are on the edge of Ipswich: Bixley, Warren Heath and Nacton at 1.2 per cent, and Westerfield, Grundisburgh and Bredfield at 1.3 per cent.
For scale, the district’s highest rate is Lowestoft Central, about 40 miles north of Woodbridge, at 6.9 per cent with 440 claimants. Lowestoft Harbour and Kirkley is next at 6.8 per cent. Neighbourhood figures only start in January 2026 on the current boundaries, so there is no year-on-year comparison for them yet.
(Nomis, claimant count by MSOA; House of Commons Library MSOA names)
What the count measures
The claimant count covers people on Jobseeker’s Allowance and people on Universal Credit who are required to look for work. It is not the full unemployment rate. It also includes some people in work on low earnings, who must look for more hours. It is, though, the only jobs measure published every month down to neighbourhood level.
What it means for you
A flat month in a rising region is good news for the district, but the steady rise among under-25s means school and college leavers are finding it slower going. If you have lost work or had hours cut, the main route into support is Universal Credit, claimed online. Low-income households can also apply to East Suffolk Council for Council Tax Reduction, which cuts the bill. Our council tax bands page sets out what each band pays this year.
The October figures are due from the ONS in November. Our last report on the count was for June.
Have your say